Dashboards Deepen Value Proposition
Software programs help security integrators engage customers with intuitive experience.

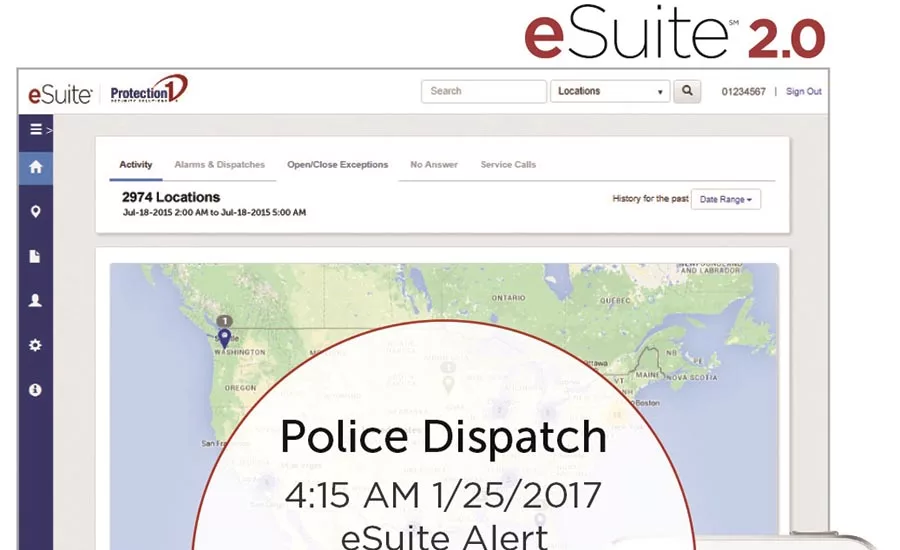
P1’s eSuite 2.0 provides real-time reporting to the dashboard or mobile devices for instant notification of the status of alarms. PHOTO COURTESY OF PROTECTION ONE
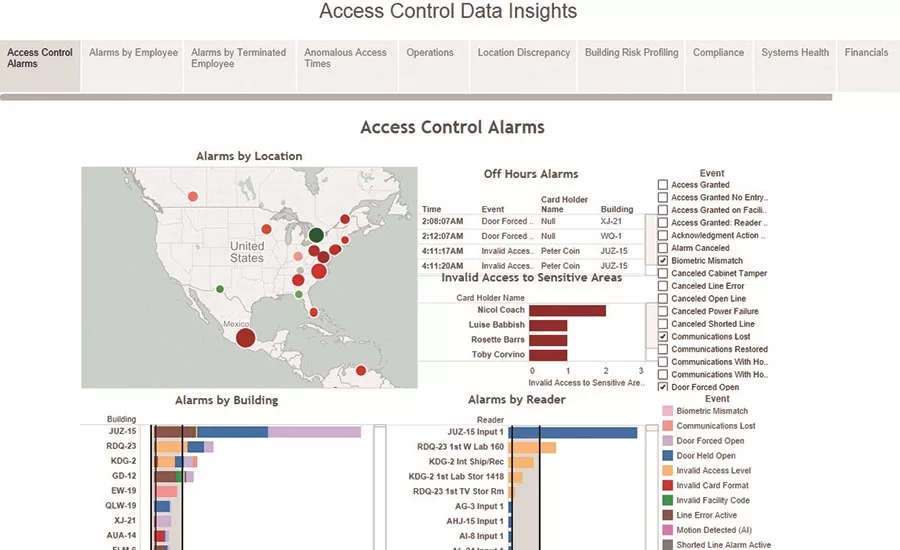
This dashboard from Stanley Security is an overview of access control alarms, showing all alarms by location, building and reader while highlighting high priority invalid access to high risk areas and off-hours alarms. PHOTO COURTESY OF STANLEY SECURITY
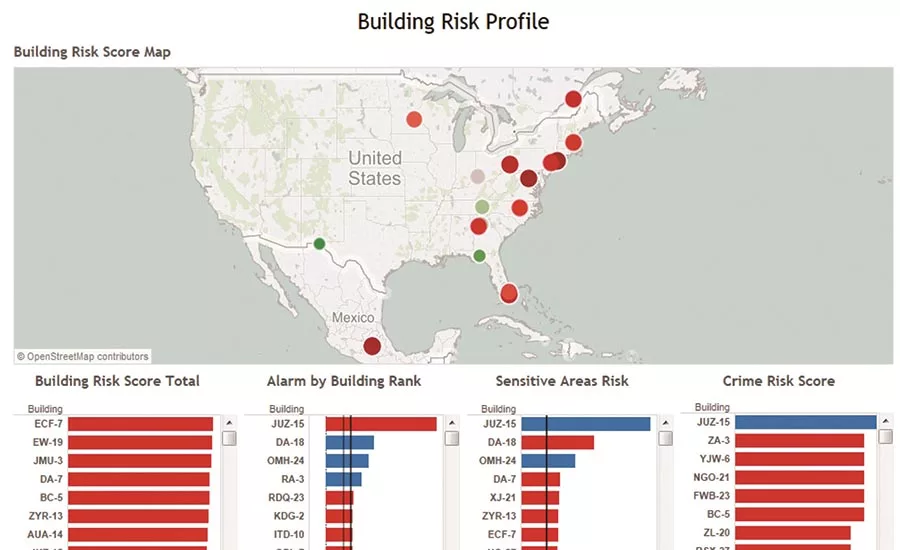
The Building Risk Profile Dashboard is dynamic and any component can be clicked to highlight the scores of a particular location. In this example Atlanta was selected because of its high building risk score. PHOTO COURTESY OF STANLEY SECURITY
End user dashboards are software-based, Web-based or cloud-hosted programs offered by security integrators, which allow their commercial end user customers to manage their security systems in a holistic manner. These dashboards provide analytics on a wide range of processes and services, including how effective security systems have been performing, downtime, system exceptions, hardware or processes experiencing excessive service calls and other deep dive info — similar to a report card on system status. Dashboards may also target monitoring operations to continually assess alarm conditions and any ongoing issues in monitoring operations and assess alarm conditions, pinpoint problem areas or consolidate alarms across the enterprise or national account base.
There are a number of different types of dashboards on the market, targeting the service they provide to the end user and the security integrator with immediate, proactive reporting. Collectively, dashboards provide insights on system status; more fully leverage the infrastructure or assets of the protected premises; and provide practical information that engages the customer and enhances their experience. It puts everything in one place and brings specific, targeted information to the top of the funnel, presenting it in a manner in which the user can quickly interpret and act on.
Dashboards also deepen the value proposition of the systems integration company and the services they provide. Often they provide notifications of exceptions with the system, including failing hardware, problem alarms or other criteria, as well as a historical report that can be used for ongoing system planning, upgrades and replacements. It’s a proactive approach that identifies ongoing issues or challenges, so the user can be assured of the greatest uptime.
PSIM Versus the End User Dashboard
Dashboards and Physical Security Information Management (PSIM) systems have some things in common. Both can put data from a variety of services in the hands of end users, making them easily digestible, understandable and providing the types of analytics that assist with the overall security and monitoring at an organization. But there is a difference between PSIMs and the platforms detailed in this article.
Dave Bhattacharjee at Stanley Security says PSIM is focused on workflow, while eServices centers on analytics.
According to Rajeeve Kaul at G4S, PSIM is a way to connect different systems and pull information into one area. “It’s incredibly expensive and traditionally very client-server based. The space we are in is more preventative maintenance monitoring.”
P1’s Lisa Ciapetta, however, says eSuite development is moving down the path of becoming more of a PSIM platform, integrating with DMP Remote Link and video from I-View Now and the IMMIX video platforms.
A VARIETY OF FLAVORS
End user dashboards are a growing example of how digital data from IP and IT systems are populating the protected premises. They come in many different “flavors” depending on what the end user is looking for or wants to achieve.
Today, with so much information coming from the facility and even more set to populate via new connectivity from the Internet of Things (IoT), it’s critical to be able to aggregate data in a highly usable and visual method, and that’s the goal of many programs. One of the most important criteria for a successful end-user dashboard is ease-of-use, as well as having information presented in a highly discernable format, especially critical for central station monitoring.
Protection 1 Security Solutions (P1), Romeoville, Ill., originally introduced its eSuite custom-built web portal about seven years ago for customers to gain greater visibility into the monitoring platforms for their alarms, says Lisa Ciappetta, senior director of national accounts. eSuite gathers data from monitored alarms and displays all the information in a consolidated view. The data can be manipulated to highlight any alarms or critical issues the customer is experiencing at a location.
Ciappetta says eSuite was built in-house and aggregates the customer’s burglar and fire alarm monitoring activity. It’s especially helpful for those customers with hundreds or thousands of alarms.
Looking for quick answers on security topics? Try Ask SDM, our new smart AI search tool. Ask SDM →
“The data can be easily manipulated to highlight any alarms or issues the customer is experiencing at any of their locations. Over the years it has been enhanced to include more security systems and capabilities based on end user requests. For example, we recently upgraded it to include functionality so customers can update location call list information, request alarm panel code changes, view video verification clips, and see live video from the same cameras,” she says.
Other capabilities, features and functionality provided to the end user from eSuite include: summary activities reports; dashboard notifications; “drag-and-drop” changes; easy-to-modify contact information for a single or multiple locations; robust reporting features; actionable location information with access to panel information for all locations; system tests at any time; permit management; product inventory; 1View Video Verification; and mobile capabilities that include view and edit location contacts, place burglar alarm panels on test or remove them from test and create temporary schedules.
End user dashboards are a growing example of how digital data from IP and IT systems are populating the protected premises.
Stanley Security, Indianapolis, has two dashboard platforms for customers, each serving a different functionality: eServices 2.0 and Insights Professional Services and Analytics Software. First released in a beta version in 2012 and now culminating in eServices 2.0, the platform is web-based, running at the Stanley Security data center and within the local intranet of the user. It was created to drive more effective security management practices at the protected premises and enhance the customer service experience, pulling together information on service calls and outstanding tickets and advanced analytics that yield preventative information, says Dave Bhattacharjee, vice president, data analytics, Stanley Security. The online management tool for customers provides real-time transparency on customers’ security systems, including intrusion, video surveillance, access control, fire detection and integration. It allows customers to streamline security and business processes, offering comprehensive insight to carry out security issues before they would negatively affect operations at one or multiple locations.
“eServices is a common interface between the customer and Stanley Security for billing, service, customer satisfaction and alarm monitoring,” Bhattacharjee says. “It aggregates info from line service tickets, billing, alarm activity and even customer satisfaction scores.” Both eServices 2.0 and Insights were design-built from the ground up at Stanley Security.
“It’s more than a software solution,” Bhattacharjee says. “It’s a consultancy program with the ability to correlate data streams, analyze trends and measure business activities and operations — using analytics to ultimately help optimize business performance…. Often customers have the ability to collect data, but no way to study it or draw meaningful conclusions from it,” he says.
With Insights, data is compiled from multiple systems and brings information to the dashboard to report on key metrics for a business, creating actionable business intelligence across their locations. “The user can track and improve metrics that directly impact the success of the organization,” Bhattacharjee says, including traffic counts, event reporting and point-of-sale exceptions to asset management, incident data and even environmental monitoring.
BEYOND THE DASHBOARD
For G4S Secure Integration, Omaha, Neb., new data is now moving dashboards more fully to the area of advanced analytics. G4S launched Service 2.0 about two years ago for the next-generation preventative maintenance service side of the business. According to Joe Young, director of Cloud Monitoring Services, the Software as a Service (SaaS) platform allows the user to receive data on how the system is operating and algorithms of the actual performance of the “assets,” which can be any IT or IP connected end point, hardware or other solution, even guard services. When the client logs into the Service 2.0 web page they can see the dashboard and other information — it’s pure cloud, and the user can log in anywhere, anytime from any browser.
“We get granular visibility with Service 2.0,” Young says. “We have specific data we can provide to the customer and it’s a powerful tool for us as we can resolve most issues remotely without a site visit. Initially, Service 2.0 provided a 40 percent reduction in informational truck rolls — which means simply going to the site to see what’s happening.”
Not only is it beneficial to the end user to see how their assets are performing, but it’s a powerful tool to resolve many issues remotely. According to Rajeeve Kaul, senior vice president, analytics and transformation, Service 2.0 lets G4S and the customer trace device uptime — for example, how long the access control panel has been online, or in the case of video, the entire journey of the video signal.
‘These programs bring validation and data to the user when you can optimize it. Without data you are basically making assumptions. This is a data-centric approach to optimizing a security program.’ — Rajeeve Kaul
“We are looking at the uptime of everything, and things like video retention compliance,” Kaul says. “If they have a policy in place and have to archive or record, this toolset needs to have a threshold so it can be critically updated. We give the customer visibility through the toolset, which provides the user the assurance that everything is working properly.” The company developed the platform in partnership with another company, he adds.
G4S leads with a fully managed service offering around Service 2.0. Kaul says dashboards are definitely here to stay, but continue to transform with new analytics. “These programs bring validation and data to the user when you can optimize it. Without data you are basically making assumptions. This is a data-centric approach to optimizing a security program. Sensors tell so much more than before. We had been in discussions with a large company that owns a mall. They wanted to be able to know when there were three of more inches of snow in the parking lot so they could dispatch snow removal. Now we haven’t reached the point where there are sensors in the parking lot, but perhaps a sprinkler went off and you want to prevent drainage overflow and water backing up into rooms. You can provide data on assets, people and optimize your security program, while reducing risk and costs and many other use cases.
“If you look at this info, it’s beyond dashboards,” Kaul adds. “You have a huge number of devices feeding into one place but one person can’t manage it effectively. You need intelligence to manage all these streams of information or build rule sets so that when a threshold is reached the user will be informed automatically.”
5 Key Takeaways
-
End user dashboards leverage the infrastructure and connected technologies with insights on systems deployment, assets, service/maintenance and monitoring.
-
Some integrators offer a light version for other integrators to deploy with their customers.
-
Practical information engages the customer and enhances the user experience.
-
Dashboards can provide notifications and history reports for system upgrades and planning.
-
Dashboards deepen the integrator value proposition with a stickier experience.
MORE ONLINE
Central station automation software is another security industry category benefitting from the digital evolution and revolution. Here’s what is happening in this growing area:
“Central Station Automation Software Gets Smarter, More Versatile”
www.SDMmag.com/central-station-automation-software-gets-smarter
Looking for a reprint of this article?
From high-res PDFs to custom plaques, order your copy today!