Security Networking
How to Test Clients’ Wi-Fi & Internet Capacities

As the computer world steams headlong into using Wi-Fi to wirelessly connect just about everything on networks, our industry is following suit. As a 42-year veteran of this business I remember the trials and tribulations and just plain hard work that was required to pull low-voltage cables to all security devices such as door contacts and motion detectors. Now by using Wi-Fi, installers only have to be concerned with a power connection, potentially eliminating the “home run” wiring back to the alarm control panel. Installations are faster, and Wi-Fi can provide device location flexibility. This is particularly important with the explosion of Wi-Fi video cameras, some of which are designed to be mounted outside to watch front doors, delivery people etc.
While Wi-Fi is great and wonderful, being wireless it doesn’t provide a visual indication of signal quality or strength. With some installations technicians can mount Wi-Fi devices, check them for functionality, and move on to the next phase of the job without testing the Wi-Fi. What isn’t often tested is the bandwidth and quality of the Wi-Fi signals between the device and the related Wi-Fi access point.
"While Wi-Fi is great and wonderful, being wireless it doesn’t provide a visual indication of signal quality or strength."
To demonstrate the different performances of Wi-Fi networks I used the “Wi Fi Speed Test” app developed by Zoltan Pallagi (pretty good pro wrestler name) on my Android phone after downloading it for free from the Google app store. Is this available for iPhone? You will have to check their app store.
In my house I have three separate Wi-Fi access points. My TRENDnet 813 router has two separately programmable Wi-Fi access points, which I have programmed to provide both 802.11b/g/n (the older Wi-Fi standard) as well as the high-powered 802.11ac. My network also has an Aruba access point that operates in the 802.11ac bands.
From the comfort of my La-Z-Boy, I tested each network using the speed test app. Here are the results:
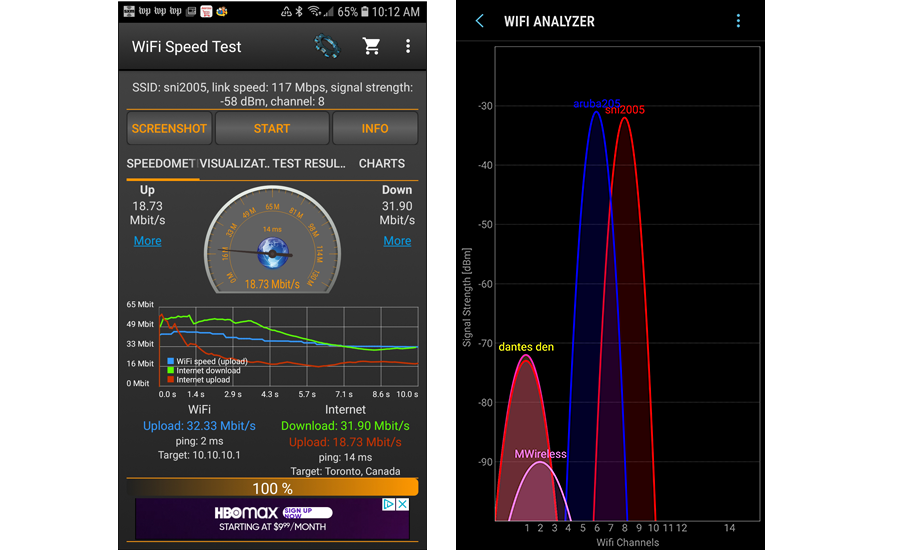
TRENDnet 813 802.11b/g/n Tests
ALL IMAGES COURTESY OF DAVE ENGEBRETSON
Once the app is downloaded and the Android is programmed to communicate to the selected Wi-Fi access point the test takes probably 45 seconds and provides a wealth of information. Here you see that the blue line (Wi-Fi connectivity) and print indicate an upload bandwidth of 32.33 Mbps. This test also tests uplink and downlink internet bandwidths, via the red and green graph lines and related printed results below. This particular test would indicate that there is a relatively small internet upload, which is the channel that IP cameras would use to send video clips or streaming video to remote locations. As the older Wi-Fi standards only have 11 total channels, signal congestion can be a real problem in closely populated areas. For example, my Android “sees” nine different Wi-Fi access points from my living room, with the signals coming from my devices and some of my neighbors. If possible, change the Wi-Fi channel in an 802.11b/g/n access point to another, less used channel. Many vendors default their b/g/n Wi-Fi devices to one of these three channels: one, six, or 11. By changing the channel to one that’s cleaner than the current channel in use, performance can drastically improve. The graphic on the right is the “WiFi Analyzer” app, which is also free and very handy as you can quickly check for crowded channels.
Looking for quick answers on security topics? Try Ask SDM, our new smart AI search tool. Ask SDM →
TRENDnet 813 802.11ac Test
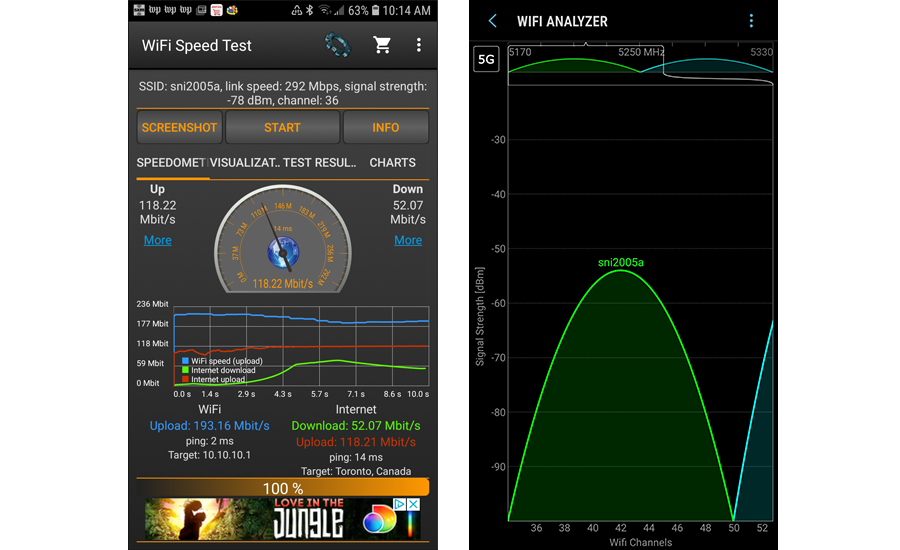
These tests show the great performance improvements that are usually available by using 802.11ac Wi-Fi access points. The Wi-Fi is up to 193 Mbps, and internet connectivity has greatly increased, probably because the Wi-Fi bandwidth is increased. The WiFi Analyzer on the right shows that the 2005a access point is on a “clean” channel with no interference. Keep in mind that there were no interfering networks at the time of the test; interference or congestion can develop if new/different access points are powered up.
Aruba 802.11ac Tests
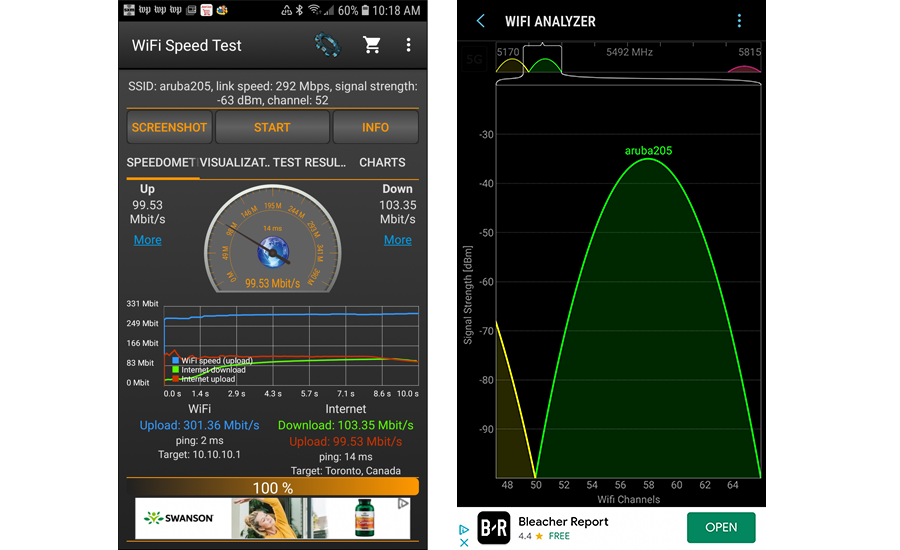
The above test results show that the Aruba 205 has higher Wi-Fi bandwidth, which translates into larger internet uploads and downloads. As can be seen on the right, WiFi Analyzer shows that the Aruba is running in a “clear” channel with no congestion.
Where & When to Use These Tests
First, have the apps loaded into your smart phone. When at the customer’s location you will need to program your phone to communicate with their existing Wi-Fi access point, using the correct SSID and security code. This programming is needed if you want to use the “WiFi Speed Test” app. The “Wi Fi Analyzer” app can show signal strengths from all available access points, and you just need to know the SSID “name” of the client’s access point. You can check for the access point’s channel being used and whether there is congestion. If you can get into the access point’s programming you can change the channel being used to one that is not crowded. Remote Wi-Fi devices do not have to be reprogrammed; when a device is trying to hook up to an access point it will scan all available channels and then connect to the one that has the correct SSID name and related security code.
These tests should be performed if you are installing Wi-Fi devices, particularly outdoor cameras or door locks. Hold your phone where you plan to hang the camera and run the tests. If the Wi-Fi tests poorly, you might try moving your phone to another location right, left, up or down and running the tests again. Sometimes a physical feature such as metal furniture, refrigerators, and other things may reduce or block the Wi-Fi communications.
Using these tests also can provide salespeople and technicians the ability to quickly quantify a client’s Wi-Fi. Numbers don’t lie and there’s the opportunity to sell the customer upgraded Wi-Fi access points.
Wi-Fi isn’t magic, and these tests provide a visual indication of connectivity and performance. Use these tests to ensure that the Wi-Fi devices you install will function reliably.
Looking for a reprint of this article?
From high-res PDFs to custom plaques, order your copy today!


