SDM EXCLUSIVE
2020 SDM 100 Report: After Peak Performance, What’s Next?
The excellent growth SDM 100 companies had in 2019, followed by the onset of the coronavirus pandemic, is like being on the summit without a clear view of the landscape. Dealers are looking to their RMR to carry them through.

On February 21, the headline in USA Today read, “CDC is preparing for the ‘likely’ spread of coronavirus in the US, officials say.”
On March 6, Reed Exhibitions, the organizers of ISC West, issued a statement explaining ISC West 2020 would be postponed until July. (The event was subsequently rescheduled for October 5-8.)
On March 12, U.S. stocks suffered their worst day since “Black Monday” on Oct. 19, 1987. Wall Street dropped into a bear market, after an 11-year run as a bull market.
SDM readers are familiar with the events — large and small — that occurred before, in between, and after these precursors to the full-on spread of the coronavirus that led to nationwide shutdowns and lockdowns. What they may not know is that the security industry had been experiencing a “bull market” of its own in many segments, and SDM 100 companies were in the process of telling us about it in their qualification forms this year, when the pandemic hit.
Objective of the SDM 100
The SDM 100 has been published since 1991. Its primary objective is to measure consumer dollars gained by security companies, in order to present an account of the size of the market captured by the 100 largest providers. SDM 100 companies are ranked by their recurring monthly revenue. RMR is the revenue associated with the contractual agreement between a security company and its subscriber — derived from customer billing for services such as monitoring, contracted service/system maintenance, security-as-a-service and managed/cloud solutions, and leasing of security systems — and is typically the basis for valuation of a security company. RMR is the language of security company executives and is meaningful in comparative analysis among industry peers.
“2019 was a positive year. Residential clients in the upper markets enjoyed positive stock market returns,” wrote JM Resources Inc. (ranked No. 99), ironically, in early March.
“If I had answered this question in late February or even early March, my answer would be completely different than it is today, and probably will be tomorrow,” wrote No. 83, Custom Alarm, in late March. “Life as we knew it has changed dramatically with the onset of COVID-19 and the impact it has already had and will continue to have on not only our industry, but our various customers’ industries is unprecedented and devastating … and will be felt for years to come. It is single-handedly changing the way everyone lives and conducts business.”
Charts and Graphs


While security is considered an essential service by the Department of Homeland Security, it doesn’t mean security companies haven’t had to shift 180 degrees in a short period of time, to modify their operations for this new normal.
Looking for quick answers on security topics? Try Ask SDM, our new smart AI search tool. Ask SDM →
Before the bottom fell out, however, the 100 largest security dealers in the U.S. as ranked on the SDM 100 had performed exceptionally well, growing total annual revenue by 9.5 percent and recurring monthly revenue (RMR) by 1 percent. Although the 1 percent RMR growth rate is insignificant, individual results tell a different story, as 84 of the 100 companies had positive RMR growth in 2019.
How to Use the SDM 100 Tables
The 2020 SDM 100 ranks U.S. companies that provide electronic security systems and services to both residential and non-residential customers. This ranking is based on information provided to or, in few cases, estimated by SDM. Ranked companies were asked to submit either an audited or reviewed financial statement, or a copy of their income tax return showing total gross receipts for the stated period. The vast majority of the firms ranked are privately held.
The main table, which begins on page 31, ranks 100 companies by their recurring monthly revenue (RMR) of December 31, 2019. The company with the highest RMR is ranked as No. 1, and so on.
SDM 100 companies are then re-ranked by several other criteria, including total annual gross revenue (page 42); residential subscribers (page 44); and non-residential sales revenue (page 46). To find a company by name, use the alphabetical index on page 48. See the report online at www.SDMmag.com/sdm100report for more data than presented here.
Note: An e following the figure indicates it is an SDM estimate.
The aggregate results were likely skewed by ADT’s and Brink’s reported RMR, which decreased 3 percent and 8 percent, respectively (ADT’s is attributed to the sale of ADT Canada; see footnote on page 31). Removing those two giants from the calculation, results in an average 8 percent increase in RMR for the remaining 90 companies collectively that ranked on the report in both 2020 and 2019. And while total sales revenue from both residential and non-residential systems increased slightly in 2019, a metric to watch carefully in the future will be the subscriber count. Collectively, the number of subscribers among SDM 100 companies has decreased marginally each year for the past three years.
The primary objective of the SDM 100 Report is to measure consumer dollars gained by security companies, in order to present an account of the size of the market captured by the 100 largest providers. SDM 100 companies are ranked by their RMR because it is the revenue associated with the contractual agreement between a security company and its subscriber — derived from customer billing for services such as monitoring, contracted service/system maintenance, security-as-a-service and managed/cloud solutions.
Seeing 2020: A Perspective on SDM 100 Growth Moving Forward

The annual publishing of the SDM 100 (now in its 30th year) usually presents an opportunity for reflecting on changes and trends in the industry dynamic. The important datapoints provided in this report are helpful in understanding overall growth rates, how various segments are doing, and the structure of the industry. This year, however, is a challenge.
The effects of COVID-19 have created such a high degree of uncertainty that it is questionable whether pre-crises trends are relevant anymore. For example, only months ago, low unemployment rates were constraining the availability of qualified labor and increasing associated costs. Today it is not clear this is or will be an issue.
With views to the future so opaque, a better place to focus is on the underlying industry fundamentals — that is, those features that are likely to continue to support the industry and any individual player, irrespective of current market forces. These fundamentals generally fall into three categories.
1. Value Proposition.
Security systems work and provide a highly valuable service. It is no coincidence that support for their operation is deemed “essential” during this crisis. For operating companies this is a good time to remind your customers that you are protecting them, and to let prospective customers know that you are operational and available. Leverage this distinction to highlight the importance of your services and to inform the market of your capabilities. This is also a good time to check your pricing. While being a responsible enterprise and enhancing your brand may entail some selective forgiveness and discounting, it is important to make sure you are profitable and/or creating value within your capital constraints. Your company benefits no one without viability. Ruthlessly cut costs and remember that virtually all sales activity is discretionary and should be undertaken only with a strong valuation proposition for your customer and for you.
2. Market Opportunity.
Penetration rates in the residential segment, while increasing, are still relatively low with much room for continued growth. Additionally, the range of products and services that can be offered has broadened materially, supported by all the new smart home technology. The commercial segment has a similarly large opportunity, particularly in upgrading existing systems to newer technology and expanding into new applications. For example, it is not hard to imagine a surge in demand for thermal cameras that can read body temperature, and frictionless access control systems that do not require users to touch anything. The market opportunity was, and will continue to be, substantial. Successful companies will stay close to their customers and listen for opportunity. Additionally, most operations should stay extremely focused (as in geographically/vertical market segment/product or service line), as this typically results in better performance. Think closer and measured versus farther and faster.
3. Industry Resilience.
During the Great Recession, this industry did relatively well. While the sale of new systems declined, it was still enough to replace attrition and as a result recurring revenue actually grew. This resilience is a byproduct of the factors discussed above, combined with the structure of the industry, which has a broad diversity of players looking at the opportunity from many different perspectives. This resilience will carry the industry through this challenging time, and it will likely fare much better than many other industries. Successful players will need to enhance their operating resilience. A big helping of recurring revenue will be the foundation for most, combined with the ability to adapt to a highly uncertain sales environment. Strong leadership is a must.
These fundamentals will support the industry and allow it to shine; but there is no doubt it will be a battle. The military teaches a concept called the OODA loop for managing combat. The acronym stands for Observe-Orient-Decide-Act, which is then repeated. The fundamentals above provide a compass to orient towards; and your customers, your employees, and your profits (and/or the avoidance of costs) are your key variables. If an action does not benefit all three, find another one.
Hopefully, next year there will be a clearer view. — Contributed by Michael Barnes, president of Barnes Associates Inc., an advisory and consulting firm that specializes in the security alarm industry. Contact him at mbarnes@barnesassociates.com or 314-616-2700.
“The market was very strong for commercial security systems sales,” reported Guardian Protection, ranked No. 6. “Integrated systems showed the most growth as commercial clients look for a unified platform to manage their business and facilities.”
Sonitrol Integrated Security, No. 88, said the strength of the market in 2019 was “being pushed along by the overall excellent economy. The Triangle area (Raleigh, Durham, Chapel Hill, N.C.) is a top 5 or top 10 rated area in all categories. So, growth is here which, of course, leads to more opportunities.”
More About the SDM 100
The SDM 100 has been published since 1991. Its primary objective is to measure consumer dollars gained by security companies, in order to present an account of the size of the market captured by the 100 largest providers. SDM 100 companies are ranked by their recurring monthly revenue. RMR is the revenue associated with the contractual agreement between a security company and its subscriber — derived from customer billing for services such as monitoring, contracted service/system maintenance, security-as-a-service and managed/cloud solutions, and leasing of security systems — and is typically the basis for valuation of a security company. RMR is the language of security company executives and is meaningful in comparative analysis among industry peers. Of the 100 security dealers ranked, 38 of them earned more than $1 million in RMR in 2018.
However, opportunities were not present across the board or without big challenges. For example, for all but a few dedicated residential players, the residential market was soft. “We found the commercial market to be quite strong. However, on the residential side, we continued to see competitive threats from the DIY market,” said Trinity Wiring & Security Solutions, ranked No. 81.
The story of 2019 is told in the tables and graphs on these pages. The story of 2020, however, is still unclear. In large part it may hinge on the stream of RMR built up by the industry’s 100 largest companies — a result of years and years of selling the value of monitored security systems.
“At Custom Alarm we are doing what we can to navigate through these times and to be there for our customers. I think having RMR as part of our business will help us manage through the difficult times as projects will be delayed and possibly cancelled due to financial constraints,” Custom Alarm projected.
For more information and how to apply to the SDM 100, click here.
How to Purchase the SDM 100 Directory
Wouldn’t it be useful to have more information about each of the 100 companies ranked here? The 2020 SDM 100 Directory includes contact names, mailing addresses, telephone numbers, website URLs, branch office locations, product buyer names, installation data, revenue sources, and more. The SDM 100 Directory comes in Microsoft Excel format. To order, contact Jackie Bean at (215) 939-8967 or by email to beanj@bnpmedia.com.
Brought to you in part by 
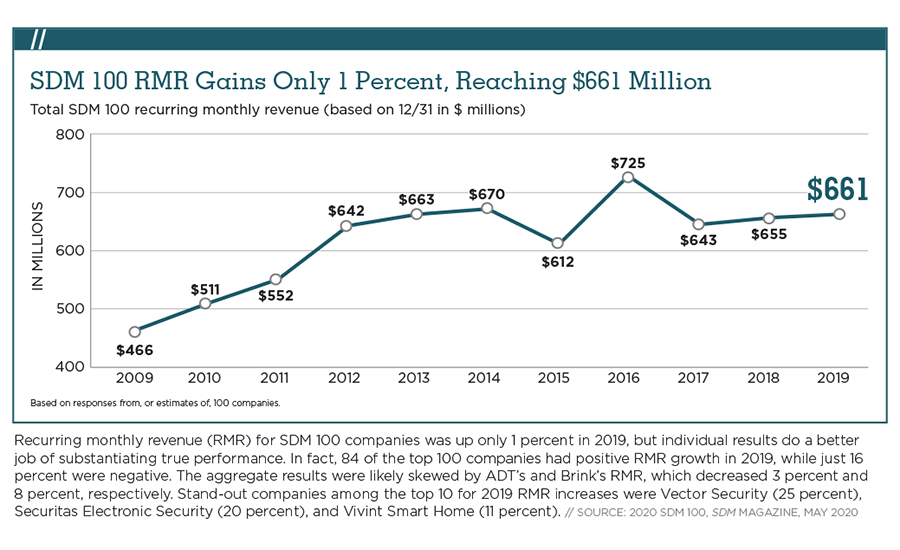
Recurring monthly revenue (RMR) for SDM 100 companies was up only 1 percent in 2019, but indvidual results do a better job of substantiating true performance. In fact, 84 0f the top 100 companies had positive RMR growth in 2019, while just 16 percent were negative. The aggregate results were likely skewed by ADT's and Brink's RMR, which decreased 3 percent and 8 percent, respectively. Stand-out companies among the top 10 for 2019 RMR increases were Vector Security (25 percent), Securitas Electronic Security (20 percent), and Vivint Smart Home (11 percent).
Source: 2020 SDM 100, SDM Magazine, May 2020
Brought to you in part by
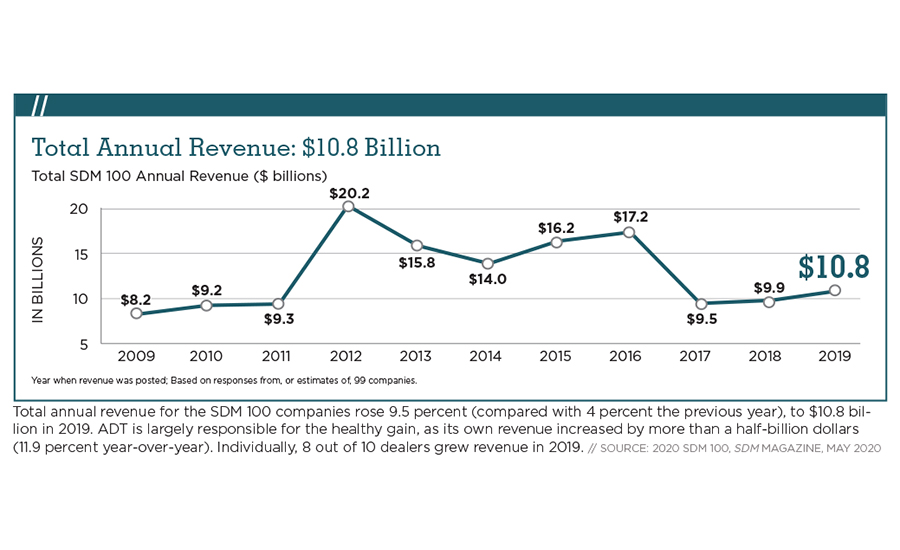
Total SDM 100 Annual Revenue ($ billions)
Year when revenue was posted; Based on responses from, or estimates of, 99 companies.
Total annual revenue for the SDM 100 companies rose 9.5 percent (compared with 4 percent the previous year), to 10.8 billion in 2019. ADT is largely responsible for the healthy gain, as its own revenue increased by more than half-billion dollars (11.9 percent year-over-year). Individualy 8 out of 10 dealers grew revenue in 2019.
Source: 2020 SDM 100, SDM Magazine, May 2020
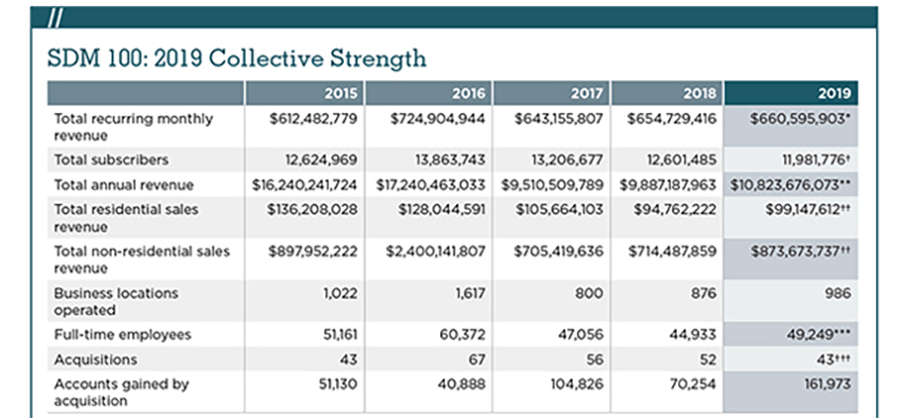
* Total monthly recurring revenue, based on RMR of Dec. 31, 2019. Based on responses or estimates from 100 companies.
† Based on responses from or estimates of 86 companies. Not included: Securitas Electronic Security; G4S Secure Integration LLC; SSD Alarm; Allied Universal Technology Services; Briscoe Protective; Redwire LLC; Sonitrol Great Lakes; Gillmore Security Systems Inc.; Richmond Alarm Company; Scarsdale Security Systems Inc.; Washington Alarm Inc.; The Protection Bureau; Yarnell Security Systems; PASS Security.
** Total annual (2019) revenue from electronic security system sales, installation, service, leasing, monitoring, and sales of subscriber accounts, as reported to or estimated by SDM. Based on responses from or estimates of 99 companies. Not included: The Protection Bureau.
†† Based on responses from or estimates of 74 companies. Note: Some companies either did not choose to report this figure or did not have sales/installation revenue to report in one of the categories.
Not included in Residential Sales Revenue are: ADT; Vivint Smart Home; Brink’s Home Security; Securitas Electronic Security; CPI Security Systems Inc.; Alert 360; My Alarm Center LLC / Alarm Capital Alliance; Kastle Systems Int’l; AMAROK LLC; NorthStar Alarm Services LLC; Per Mar Security Services; SafeTouch; G4S Secure Integration LLC; SSD Alarm; Allied Universal Technology Services; Briscoe Protective; AMP Smart LLC; Star Asset Security; Structure Works Inc.; A+ Technology & Security Solutions Inc.; EyeQ Monitoring; Richmond Alarm Company; Scarsdale Security Systems Inc.; The Protection Bureau; Hoffman Electronic Security; Sound Inc.; Trinity Wiring & Security Solutions; Yarnell Security Systems; Advent Security Corporation; Fortress Security; JSC Systems Inc.; Key Security Designs Corporation.
Not included in Non-residential Sales Revenue are: ADT; Vivint Smart Home; Brink’s Home Security; Securitas Electronic Security; CPI Security Systems Inc.; Alert 360; My Alarm Center LLC / Alarm Capital Alliance; Safe Home Security Inc. / Security Systems Inc.; Kastle Systems Int’l; AMAROK LLC; NorthStar Alarm Services LLC; Per Mar Security Services; SafeTouch; Select Security; SSD Alarm; Briscoe Protective; AMP Smart LLC; Richmond Alarm Company; Scarsdale Security Systems Inc.; The Protection Bureau; Hoffman Electronic Security; Sound Inc.; Trinity Wiring & Security Solutions; Yarnell Security Systems; Advent Security Corporation; Fortress Security.
*** Based on responses from or estimates of 96 companies.
††† Based on responses from or estimates of 27 companies.
Source: 2020 SDM 100, SDM Magazine, May 2020
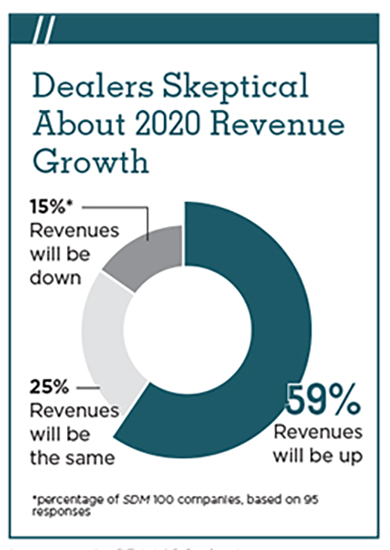
*percentage of SDM 100 companies, based on 95 responses
Source: 2020 SDM 100, SDM Magazine, May 2020
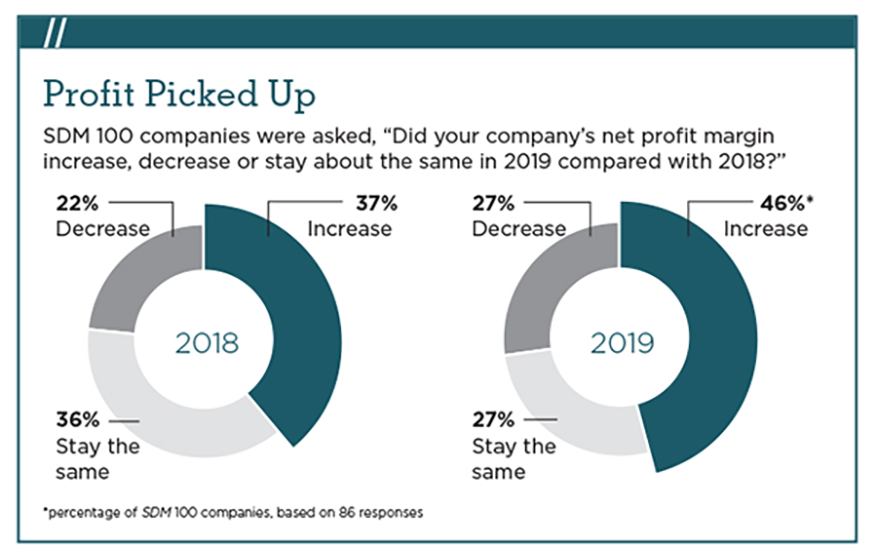
*percentage of SDM 100 companies, based on 86 responses
Source: 2020 SDM 100, SDM Magazine, May 2020
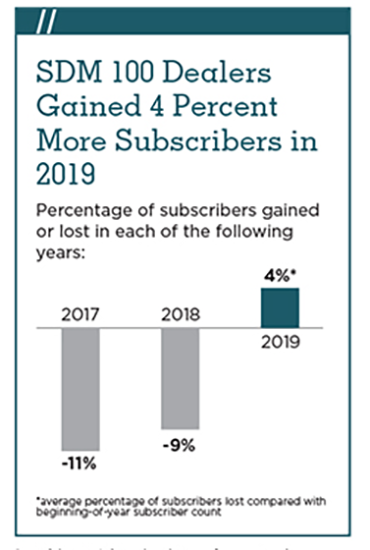
*average percentage of subscribers lost compared with beginning-of-year subscriber count
Source: 2020 SDM 100, SDM Magazine, May 2020
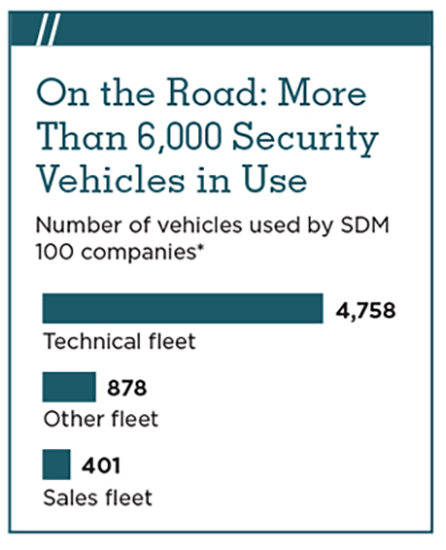
Number of vehicles used by SDM 100 companies*
Source: 2020 SDM 100, SDM Magazine, May 2020
Looking for a reprint of this article?
From high-res PDFs to custom plaques, order your copy today!


