2019 SDM 100: Above Average
May 9, 2019
2019 SDM 100: Above Average
May 9, 2019Security dealers participating in the 29th annual SDM 100 Report say last year’s financial performance was very similar to 2017’s. In fact, in some ways they found 2018 to be more stable, following a few years in which dealers experienced a lot of turmoil caused by big-name competition, pricing pressure, technology acceleration, and other disruptive forces. In 2018, the 100 largest security companies, as ranked on the 2019 SDM 100, collectively improved their recurring monthly revenue 2 percent and their gross annual revenue 4 percent, compared with 2017. Ninety-one of the 100 companies expanded their RMR.
The news is better than that, however, when one considers that performance varies each year as ranked companies move on or off the report (either because of acquisition or by declining to participate). A comparison of only the companies ranked in both 2018 and 2019 shows that RMR growth was actually 5 percent — this is a better reflection of RMR performance and a more equitable way to measure the success last year of the 100 largest security companies.
The primary objective of the SDM 100 Report is to measure consumer dollars gained by security companies, in order to present an account of the size of the market captured by the 100 largest providers. SDM 100 companies are ranked by their RMR because it is the revenue associated with the contractual agreement between a security company and its subscriber — derived from customer billing for services such as monitoring, contracted service/system maintenance, security-as-a-service and managed/cloud solutions. SDM 100 security dealers mutually tallied $655 million in RMR on December 31, 2018, on 12.6 million subscribers.
In 2018, EMC Security, ranked No. 32, observed “continued expansion of the commercial and integrated market segment, as businesses update systems and expand facilities.” EMC noted that the “residential market customer acquisition costs continue to rise as new competitors enter the market with aggressive marketing and pricing. This resulted in adding fewer monitored customers than in the previous year.”
EMC’s observation is right on target. Overall (comparing only the companies ranked in both 2018 and 2019), the total number of subscribers declined by 1 percent. However, this slight decline should be noticed along with the fact that residential sales revenue also slipped again last year. SDM 100 security dealers logged $105.7 million in residential sales in 2017, but just $94.8 million in 2018. And dealers lost an average of 9 percent of all their subscribers between 2017 and 2018, a slight improvement over 2017’s 11 percent subscriber loss. (See chart on page 46 for more details.)
While many of the security dealers in the report stated their residential business is significantly slowing, others continue to be successful and it’s as if the market is forcing a separation of “generalist” security dealers to serve, in the future, either the residential market or the non-residential market — but not both.
“The residential market was slow, but the commercial market grew to make up for the lack of residential sales,” states No. 47, All Guard Alarm Systems Inc.
“In 2018, we enjoyed a strong market — which led to a record-setting year for ADS Security in terms of both organic and acquisition growth. Our fastest growing segment (organically) continued to be commercial, most notably driven by the sale of video surveillance solutions,” shares ADS Security, No. 15.
Looking for quick answers on security topics? Try Ask SDM, our new smart AI search tool. Ask SDM →
Looking for a reprint of this article?
From high-res PDFs to custom plaques, order your copy today!
More About the SDM 100
The SDM 100 has been published since 1991. Its primary objective is to measure consumer dollars gained by security companies, in order to present an account of the size of the market captured by the 100 largest providers. SDM 100 companies are ranked by their recurring monthly revenue. RMR is the revenue associated with the contractual agreement between a security company and its subscriber — derived from customer billing for services such as monitoring, contracted service/system maintenance, security-as-a-service and managed/cloud solutions, and leasing of security systems — and is typically the basis for valuation of a security company. RMR is the language of security company executives and is meaningful in comparative analysis among industry peers. Of the 100 security dealers ranked, 38 of them earned more than $1 million in RMR in 2018.
No. 2-ranked Vivint Inc. continues to lead the residential market (absent specific residential growth figures from ADT) with double-digit (17 percent) RMR growth again in 2018 and 1.4 million subscribers.
“The market continued to be strong as consumers demonstrated increasing enthusiasm for adoption of smart home capability beyond traditional security systems. Approximately 90 percent of new Vivint customers are choosing to add smart home capabilities such as connected locks, lights, thermostats and cameras,” the company describes.
In terms of market drivers and sales opportunities, some dealers saw a reduced need for integration (except among the highest tier of customers), while others found plenty of integration opportunities. But, the clear winner in terms of growth drivers is video — in all its many forms, and in both residential and non-residential applications.
“We saw a very strong interest in video monitoring applications as well people looking to continue taking advantage of emerging CCTV technology,” notes Sonitrol of Sacramento & Orange County, Cybex Security Solutions, ranked No. 39. “The market was very strong.”
According to No. 91-ranked LOUD Security Systems Inc., the influence of apps is present and growing. “We are continuing to see growth on the commercial side of our business; we see increasing interest in card access and cameras that are managed through an app.”
“Clients are pushing for more coverage of their business and better quality of cameras. Video analytics has become a buzzword with many savvy end users expecting more from their systems,” describes Advanced Electronic Solutions, No. 76.
“Commercial market has stayed the same for us: a mixture of burg and fire with the addition of cameras on almost every job. Residential market involves inquiries into a camera on every lead!” underscores Advent Security Corporation, No. 87.
And the cloud can’t be ignored as a growth opportunity, as many of these security dealers seek to transition from a hardware model to a services model, with the potential to propel RMR beyond just the “average” growth they say they are now experiencing.
How to Use the SDM 100 Tables
The 2019 SDM 100 ranks U.S. companies that provide electronic security systems and services to both residential and non-residential customers. This ranking is based on information provided to or, in few cases, estimated by SDM. Ranked companies were asked to submit either an audited or reviewed financial statement, or a copy of their income tax return showing total gross receipts for the stated period. The vast majority of the firms ranked are privately held.
The main table, ranks 100 companies by their recurring monthly revenue (RMR) of December 31, 2018. The company with the highest RMR is ranked as No. 1, and so on. For each of the 100 companies, the following information is provided, from left to right:
- current year rank, which is based on Dec. 31, 2018, RMR;
- prior year rank;
- company name, as used in the marketplace, and headquarters location;
- amount of RMR billed on Dec. 31, 2018;
- percentage of RMR increase/decrease compared with Dec. 31, 2017;
- number of subscribers (recurring-billable customers) at year-end 2018;
- amount of sales revenue from residential system installations in 2018;
- amount of sales revenue from non-residential system installations in 2018;
- total gross revenue, in calendar-year or (the company’s) fiscal-year 2018 from security system sales/installation, service, leasing, and monitoring;
- number of full-time employees; and
- number of business locations, including headquarters.
SDM 100 companies are then re-ranked by several other criteria, including total annual revenue; residential subscribers; and non-residential sales revenue. See the report online at www.sdmmag.com/2019-SDM-100-Rankings for more data than presented here.
Note: An e following the figure indicates it is an SDM estimate.
To find a company by name, use the alphabetical index here.
“The market for us overall was steady and average. The largest increase in growth occurred in the cloud space,” says Koorsen Fire & Security, No. 66.
“Still strong with more opportunities in cloud-based solutions and products. Advances in technology continue to lead the way, allowing for more fully integrated systems. Less growth in traditional hardware-based systems in both commercial and residential markets,” describes American Alarm & Communications, No. 24.
“The market continues to create more opportunities for hosted and managed services, and total security solutions. Artificial intelligence and machine learning in access control and video surveillance continue to improve and become more obvious in use and application,” emphasizes No. 56-ranked Allied Universal Security Systems.
Security dealers are enormously optimistic about the remainder of this year, with 90 percent expecting increased revenue, and 9 percent expecting no change.
“In general, this is a function of a strong economy, and a continued heightened awareness of both security and the desire for deeper intelligence in smart homes and businesses facilities that incorporate automation, access control and an ever-growing demand for video surveillance that can both protect and monitor employees and visitors,” envisages ADS Security.
Charts and Graphs


How to Purchase the SDM 100 Directory
Wouldn’t it be useful to have more information about each of the 100 companies ranked here? The 2018 SDM 100 Directory includes contact names, mailing addresses, telephone numbers, website URLs, branch office locations, product buyer names, installation data, revenue sources, and more. The SDM 100 Directory comes in Microsoft Excel format. To order, contact Jackie Bean at (215) 939-8967 or by email to beanj@bnpmedia.com.
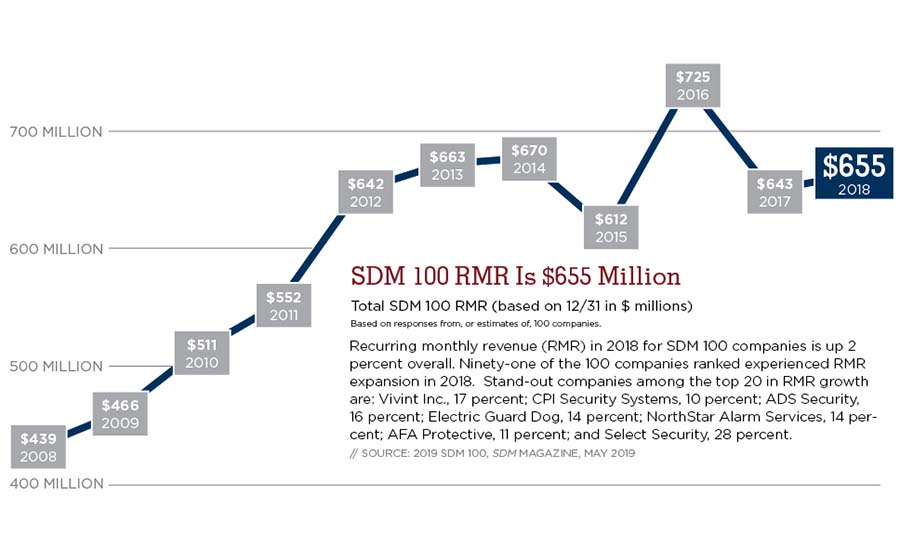
Recurring monthly revenue (RMR) in 2018 for SDM 100 companies is up 2 percent overall. Ninety-one of the 100 companies ranked experienced RMR expansion in 2018. Stand-out companies among the top 20 in RMR growth are: Vivint Inc.,17 percent; CPI Security Systems, 10 percent; ADS Security, 16 percent; Electric Guard Dog, 14 percent; NorthStar Alarm Services, 14 percent; AFA Protective, 11 percent; and Select Security, 28 percent.
Source: 2019 SDM 100, SDM Magazine, May 2019
Year when revenue was posted
Based on responses from, or estimates of, 100 companies.
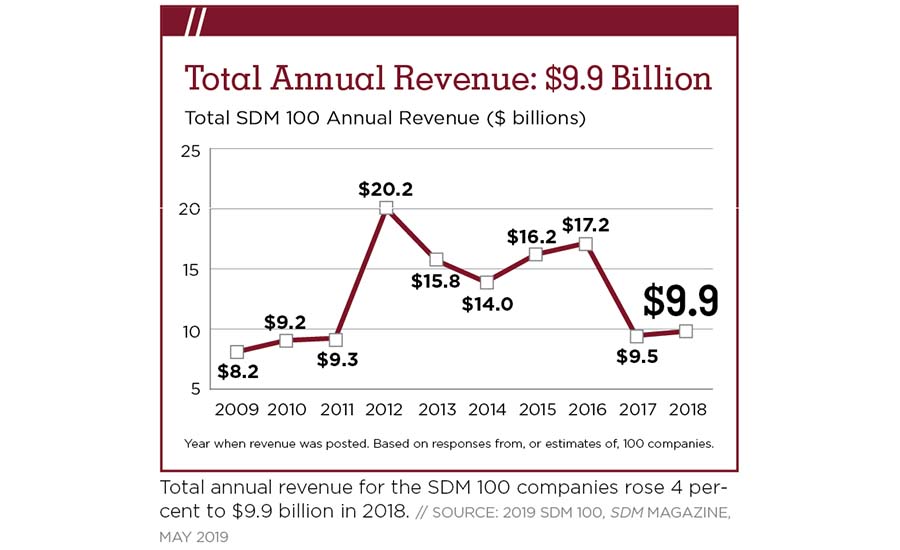
Total annual revenue for the SDM 100 companies rose 4 percent to $9.9 billion in 2018.
Source: 2019 SDM 100, SDM Magazine, May 2019
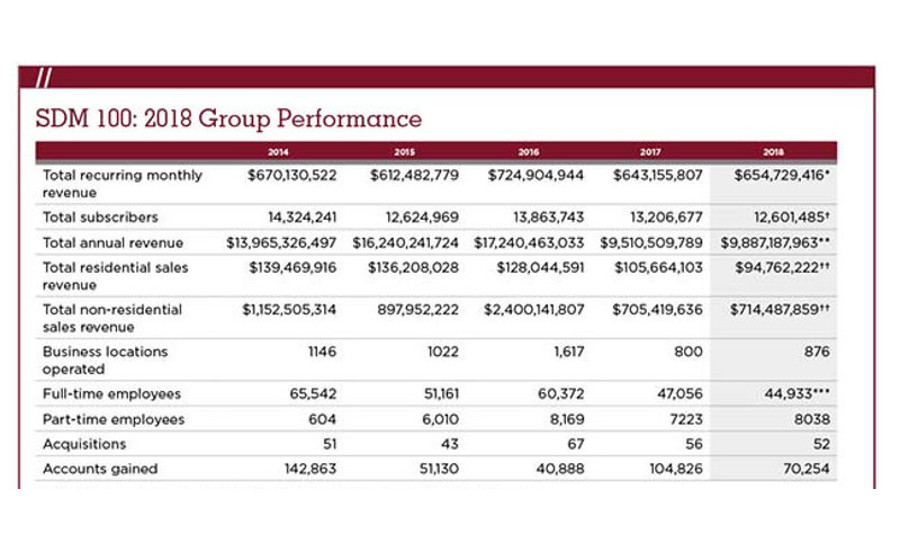
* Total monthly recurring revenue, based on RMR of Dec. 31, 2018. Based on responses or estimates from 100 companies.
! Based on responses from or estimates of 92 companies. Not included: Securitas Electronic Security; SSD Alarm; Post Alarm Systems; Habitec Security; Gillmore Security Systems Inc.; Richmond Alarm Company; Washington Alarm Inc.; PASS Security
** Total annual (2018) revenue from electronic security system sales, installation, service, leasing, monitoring, and sales of subscriber accounts, as reported to or estimated by SDM. Based on responses from or estimates of 100 companies.
!! Based on responses from or estimates of 81 companies. Note: Some companies either did not choose to report this figure or did not have sales/installation revenue to report in one of the categories.
Not included in Residential Sales Revenue are: ADT; Vivint Inc.; Brink’s Home Security; CPI Security Systems; Central Security Group; Securitas Electronic Security; Kastle Systems Int’l; Electric Guard Dog; SafeTouch; SSD Alarm; General Security Inc.; AMP Smart LLC; Star Asset Security; Post Alarm Systems; A-Com Protection Services Inc.; Richmond Alarm Company; Sound Inc.; Trinity Wiring & Security Solutions; Yarnell Security Systems; Fortress Security
Not included in Non-residential Sales Revenue are: ADT; Vivint Inc.; Brink’s Home Security; CPI Security Systems; Central Security Group; Securitas Electronic Security; Kastle Systems Int’l; Electric Guard Dog; SafeTouch; SSD Alarm; General Security Inc.; AMP Smart LLC; Star Asset Security; Post Alarm Systems; A-Com Protection Services Inc.; Richmond Alarm Company; Sound Inc.; Trinity Wiring & Security Solutions; Yarnell Security Systems; Fortress Security
Source: 2019 SDM 100, SDM Magazine, May 2019


